Trade Ideas Strategies
Select Pre-Configured strategies for Trade Ideas windows from the navigation menu on the left. Or select Start from Scratch to open a new configuration window.
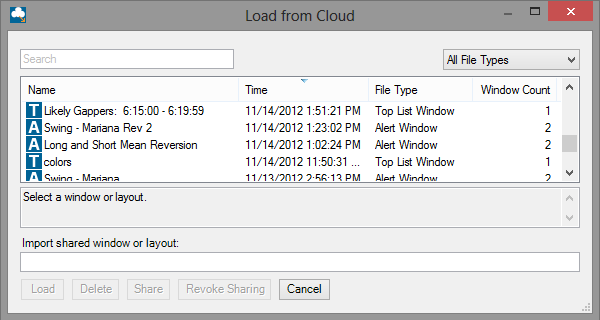
Select your saved or recently used strategy
Alerts
Select from the pre-configured alerts using the menu on the left or select the 'Start from Scratch' button to configure your own.
Neutral
Choose a neutral strategy from the folder on the left.
Bullish
Choose a bullish strategy from the folder on the left.
Bearish
Choose a bearish strategy from the folder on the left.
Top Lists
Select from the pre-configured alerts using the menu on the left or select the 'Start from Scratch' button to configure your own.
Choose a gainer themed Top List strategy from the folder on the left.
Choose a loser themed Top List strategy from the folder on the left.
Optimized
Choose an optimized strategy from the folder on the left.
Choose a range themed Top List strategy from the folder on the left.
Choose a volume themed Top List strategy from the folder on the left.
Choose a gaps themed Top List strategy from the folder on the left.
Choose a up/down candle themed Top List strategy from the folder on the left.
Choose a Top List strategy from the folder on the left.
Multi-Strategy
Select from the pre-configured Multi-Strategy using the menu on the left.
Turbo Breaks
This window was made by our Director of Education Jamie Hodge.
Jamie has over 16 years experience as a professional trader and built this simple buy very powerful strategy to help our users feel the tape as well as spot meaningful opportunities as they take place. He combines volume and today’s highs and lows to find moves that all traders need to see.
ALERTS:
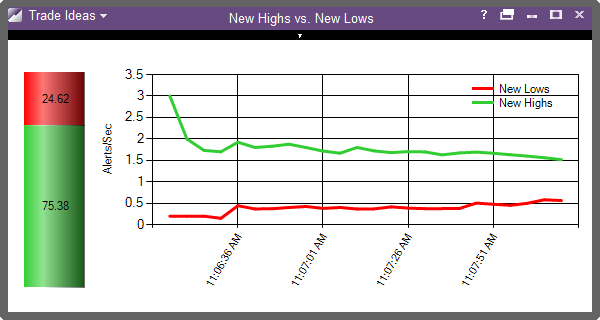
New High / New Low
WINDOW SPECIFIC FILTERS:
Distance from Inside Market < 0.2%
Price > $5
Average Daily Volume (10d) > 500k shares
1 Minute Volume > 300%
See it Before the Breaking News
Volume and how sudden it is relative to history is a tell tail sign of breaking news or just something unusual happening.
You want to be there first! In this window we use several techniques to find stocks where activity is so unusual it could be a sign of breaking news. Especially important at the open this window will help you find the names in the news.
ALERTS:
1 minute volume spike; 30
Strong volume
Unusual number of prints; 20
New Daily Highs
This window will find stocks making new intra-day highs.
ALERTS:
New High (filtered)
New Pre-market high
New Post-market high
WINDOW SPECIFIC FILTERS:
Price > $1
Average Daily Volume (10d) > 200k
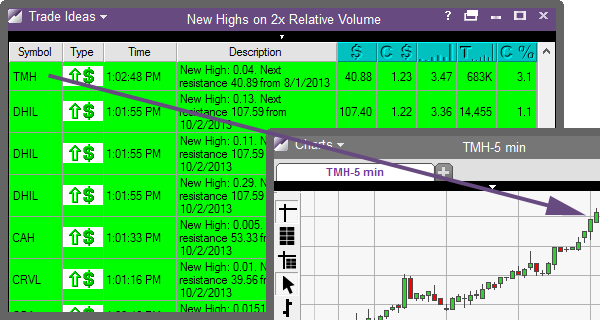
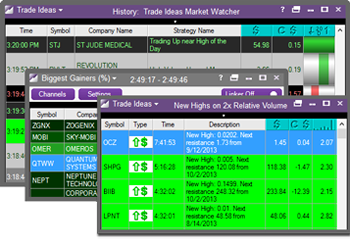
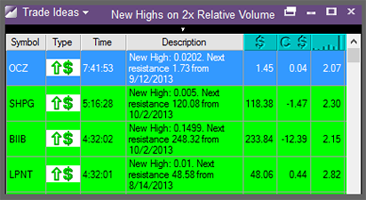
New Highs on 2x RV
This window shows stocks making new highs on 2x their current volume.
ALERTS:
New High (filtered)
WINDOW SPECIFIC FILTERS:
Price > $1
Average Daily Volume > 200k shares
Current Volume > 2
52 Week Highs
This window shows stocks making a new 52 week high.
ALERTS:
New High (filtered); 365
WINDOW SPECIFIC FILTERS:
Price > $1
Average Daily Volume > 200k shares
Turbo Breaks Up
This window was made by our Director of Client Education, Jamie Hodge. Jamie has over 16 years experience as a professional trader and built this simple but very powerful strategy to help our users feel the tape as well as spot meaningful opportunities as they take place.
ALERTS:
New High
WINDOW SPECIFIC FILTERS:
Distance from Inside Market < 0.2%
Price > $5
Average Daily Volume (10d) > 500k shares
1 Minute Volume > 300%
Up >3% Reporting Earnings Today
This alert window looks for stocks that are seeing strong demand prior to or on the day of earnings. The alert is triggered when a stock trades up 3% or more. Then we use our filter which looks only at stocks reporting earnings during the day or after the bell. Earnings plays usually have a high degree of volatility so if you are looking for market action this is a good strategy!
ALERTS:
% Up for Day; 3%
WINDOW SPECIFIC FILTERS:
Price > $1; < $1000
Earnings Date > 0; < 1
Average Daily Volume (3m) > 100k shares
High Volume Daily SMA Breakout
Some of the most popular buying points for institutional and retail traders around the 200, 50, and 20 day simple moving averages of a stock. This alert window is set to show you any time a stock crosses above one of these moving averages with very high volume behind the move. It is the combination of important price point with unusual volume that makes this window worth watching.
ALERTS:
Crossed above 200 day moving average
Crossed above 50 day moving average
Crossed above 20 day moving average
WINDOW SPECIFIC FILTERS:
Price > $1; <$1,000
Current Volume > 2
Average Daily Volume (10d) > 50k shares
Up Big in Pre-Market
When something big happens before the market opens, stocks start trading actively in the pre-market session. This window will help you see where all of the big pre-market action is taking place. Be careful trading the pre-market as swings can be wild, but keep an eye on these stocks as something big is happening.
ALERTS:
Pre-market highs
FILTERS:
Up from the close > 2%
Average Daily Volume (10d) > 100k shares
Stocks Under $20 Moving Up Fast
This alert window focuses on less expensive stocks in terms of price per share and lets you see as these stocks are making their move. This allows our users to focus on one of the more popular market segments. The stocks that are coming across this window are in play. If you see one stock continuously coming across this window, you may want to pay closer attention to that stock.
ALERTS:
New high (filtered)
75% pullback from lows
% up for the day; 5
Sector breakout from close
Positive market divergence
Running up now; .25
15 minute consolidation breakout
30 minute consolidation breakout
Crossed above resistance
60 minute high
Upward thrust (15m)
WINDOW SPECIFIC FILTERS:
Price < $20
Current Volume > 1
Average Daily Volume (10d) > 100k shares
Up 5 Minutes > $0.05
Up 5 Minutes > 0.3%
Down Big Yesterday but Up Big Today
This window is set up to show stocks that were down at least 5% as of the close yesterday, but up at least 3% today. This window is great for finding stocks that are "in play". Often the volatility in stocks that show up in this window provides great day trading opportunities for long and short traders.
ALERTS:
New high
WINDOW SPECIFIC FILTERS:
Price > $2
Down Previous Day > 5%
Up from Close > 3%
Volume Today > 50k shares
Bottoms - Pattern Recognition
This strategy looks to find real-time patterns using algorithms tested and defined by MIT. Our team applied those algorithms to process real-time data. The software is looking for various bottoming patterns to help identify good buying opportunities. The key difference between Trade Ideas technology and other pattern recognition services is the real-time data. Notice that our software is updating as the pattern develops. This can only be done if you are watching every tick in real-time and then alerting you as soon as the pattern takes place.
ALERTS:
Triangle bottom; 5
Rectangle bottom; 5
Double bottom; 5
Inverted head and shoulders; 5
WINDOW SPECIFIC FILTERS:
Price > $5
Current Volume > 1
Average Daily Volume (5d) > 500k shares
Up $.50 in Last 5 Min on Volume
Up 50 cents or more in the last 5 minutes with big volume utilizes a combination of alerts and filters specifically aimed at isolating large price spikes with unusual volume. Traders can use this move to either fade stocks that are overextended or as a precursor to more upside. Use this strategy as is or modify the window specific filter values to isolate moves types that are important to you.
ALERTS:
New high (filtered)
Running up now Block trade; 50,000
WINDOW SPECIFIC FILTERS:
Up 5 Minute > $0.50
Distance from Inside Market < 0.5%
Volume 5 Minute > 200%
Rallying off of the Bottom
This window helps find stocks that are making a move up off of the lower end of the trading range. Ideal for spotting reversals, the events in this window can be played in either direction so use a chart to confirm the set up. ALERTS: Running up now; $.20 15 minute consolidation breakout Upward thrust (15m) 20 period SMA crossed above 200 period SMA (15m) 60 minute MACD crossed above signal line 60 minute MACD corssed above zero 60 minute stochastic crossed above 20.
WINDOW SPECIFIC FILTERS:
Position in Range < 35
Current Volume > 1
Up Candles (5m) > 2
Average Daily Volume (10d) > 100k shares
Bullish Candlestick Patterns
This alert window utilizes Trade-Ideas real-time Japanese Candlestick recognition algorithms. Japanese Candlesticks have long been a popular method of spotting good inflection points for stocks. The trouble has been how to know when these patterns take place. Now you can use this Bullish pattern window to find good possible long entry candidates. This window is well suited for intra-day traders. Add additional filters to model your strategy.
ALERTS:
10/15/30 minute hammer
5/10/15/30 minute bullish engulfing
5/15/30 minute piercing pattern
WINDOW SPECIFIC FILTERS:
Up from the Close > $0.05
Spread < $0.10
Volatility > $0.05
Average Daily Volume(10d) > 200k shares
Consecutive 10 Minute Down Candles > 3
Oversold on Daily and 15 Minute
This window is set up to show stocks that have a Relative Strength Index (RSI)below 30 on a daily and 15 minute time frame. Generally this is a signal of weakness but may be in a turn-around position. There are different ways to trade RSI signals. To find out what is working in today's market, use the OddsMaker.
ALERTS:
New low
WINDOW SPECIFIC FILTERS:
Daily RSI < 30
15 minute RSI < 30
Stocks up 5 days in a row
This alert window is set to find stocks that have been closing higher the last 5 days. The alert window will alert you when the trend today continues in the direction of the overall uptrend. If when you look at this window the overall market is showing strength these stocks may be well positioned to go higher.
ALERTS:
75% pullback from lows
Check mark
Crossed above 200/50/20 day SMA
Gap down reversal
False gap up retracement
30 minute consolidation breakout
Crossed above resistance
Broadening bottom
Triangle bottom
Rectangle bottom
Double bottom
60 minute opening range breakout
WINDOW SPECIFIC FILTERS:
Spread < $0.10
Up from close > $0.50
Up from the open > $0.10
Up days > 4
Average daily volume (10d) > 200k shares
Up Big in Post Market
When news breaks or something unusual takes place after the close stocks become actively traded in the post market session. This window will help you see where all of the big post market action is taking place. Be careful trading the post market as swing can be wild, but keep an eye on these stocks for tomorrow's trading session.
ALERTS:
Post market high
WINDOW SPECIFIC FILTERS:
Average daily volume (10d) >= 100k shares
Up from the close >= 2%
New Daily Lows
This window will find stocks making new intra-day lows.
ALERTS:
New Low (filtered)
New Pre-market low
New Post-market high
WINDOW SPECIFIC FILTERS:
Price > $1
Average Daily Volume (10d) > 200k
New Lows on 2x Relative Volume
This window shows stocks making new lows on 2x their current volume.
ALERTS:
New Low (filtered)
WINDOW SPECIFIC FILTERS:
Price > $1
Average Daily Volume > 200k shares
Current Volume > 2
52 Week Lows
This window shows stocks making a new 52 week low.
ALERTS:
New Low (filtered); 365
WINDOW SPECIFIC FILTERS:
Price > $1
Average Daily Volume > 200k shares
Turbo Breaks Down
This window was made by our Director of Client Education, Jamie Hodge. Jamie has over 16 years experience as a professional trader and built this simple but very powerful strategy to help our users feel the tape as well as spot meaningful opportunities as they take place.
ALERTS:
New Low
WINDOW SPECIFIC FILTERS:
Distance from Inside Market < 0.2%
Price > $5
Average Daily Volume (10d) > 500k shares
1 Minute Volume > 300%
Down >3% Reporting Earning Today
This alert window looks for stocks that are seeing strong demand prior to or on the day of earnings. The alert is triggered when a stock trades up 3% or more. Then we use our filter which looks only at stocks reporting earnings during the day or after the bell. Earnings plays usually have a high degree of volatility so if you are looking for market action this is a good strategy!
ALERTS:
% Down for Day; 3%
WINDOW SPECIFIC FILTERS:
Price > $1; < $1000
Earnings Date > 0; < 1
Average Daily Volume (3m) > 100k shares
High Volume Daily SMA Breakdown
Some of the most popular selling points for institutional and retail traders around the 200, 50, and 20 day simple moving averages of a stock. This alert window is set to show you any time a stock crosses below one of these moving averages with very high volume behind the move. It is the combination of important price point with unusual volume that makes this window worth watching.
ALERTS:
Crossed above 200 day moving average
Crossed above 50 day moving average
Crossed above 20 day moving average
WINDOW SPECIFIC FILTERS:
Price > $1; <$1,000
Current Volume > 2
Average Daily Volume (10d) > 50k shares
Down Big in Pre Market
When something big happens before the market opens, stocks start trading actively in the pre-market session. This window will help you see where all of the big pre-market action is taking place. Be careful trading the pre-market as swings can be wild, but keep an eye on these stocks as something big is happening.
ALERTS:
Pre-market highs
FILTERS:
Up from the close > 2%
Average Daily Volume (10d) > 100k shares
Tops - Pattern Recognition
This strategy looks to find real-time patterns using algorithms tested and defined by MIT. Our team applied those algorithms to process real-time data. The software is looking for various topping patterns to help identify selling or short selling opportunities. The key difference between Trade Ideas technology and other pattern recognition services is the real-time data. Notice that our software is updating as the pattern develops. This can only be done if you are watching every tick in real-time and then alerting as soon as the pattern takes place.
ALERTS:
Triangle tops; 5
Rectangle tops; 5
Double tops; 5
Head and shoulders; 5
WINDOW SPECIFIC FILTERS:
Price > $5
Current Volume > 1
Average Daily Volume (5d) > 500k shares
Bearish Candlestick Patterns
This alert window utilizes Trade-Ideas real-time Japanese Candlestick recognition algorithms. Japanese Candlesticks have long been a popular method of spotting good inflection points for stocks. The trouble has been how to know when these patterns take place. Now you can use this Bearish pattern window to find good possible short entry candidates. This window is well suited for intra-day traders.
ALERTS:
10/15/30 minute hanging man
5/10/15 minute bearish engulfing
5/10/15/30 minute dark cloud cover
FILTERS:
Down from the Close > $0.05
Spread < $0.10
Volatility > $0.05
Average Daily Volume > 200k shares
Consecutive 10 Minute Up Candles > 3
Overbought Based on RSI Above 70 on Daily and 15 Minute Chart
This window is set up to show stocks that have a Relative Strength Index (RSI) above 70 on a daily and 15 minute time frame. There are different ways to trade RSI strength signals. To find out what is working in today's market simply right click and select the option to Run OddsMaker. The results will give you instant feedback on the viability of this strategy as a long or a short strategy.
ALERTS:
New high
WINDOW SPECIFIC FILTERS:
Daily RSI > 70
15 minute RSI > 70
Stocks Down 5 Days in a Row
This alert window is set to find stocks that have been closing lower the last 5 days. The alert window will alert you when the trend today continues in the direction of the overall downtrend. If when you look at this window the overall market is showing weakness these stocks may be well positioned to go lower. ALERTS: 75% pullback from highs Check mark Crossed below 200/50/20 day SMA Gap up reversal False gap down retracement 30 minute consolidation breakdown Crossed below support Broadening top Triangle top Rectangle top Double top 60 minute opening range breakdown.
WINDOW SPECIFIC FILTERS:
Spread < $0.10
Down from close > $0.50
Down from the open > $0.10
Down days > 4
Average daily volume (10d) > 200k shares
Down Big in Post Market
When something big happens after the market closes, stocks start trading actively in the post market session. This window will help you see where all of the bearish post market action is taking place. Be careful trading the post-market as swings can be wild, but keep an eye on these stocks as something big is happening right now.
ALERTS:
Post market low
WINDOW SPECIFIC FILTERS:
Average daily volume (10d) >= 100k shares
Down from the close >= 2%
Up Big Yesterday, Down Big Today
This window is set up to show stocks that were up at least 10% as of the close yesterday, but down at least 3% today. This window is great for finding stocks that are "in play". Often the volatility in stocks that show up in this window provides great day trading opportunities for long and short traders.
ALERTS:
New low
WINDOW SPECIFIC FILTERS:
Price >= 5
Down from the close >= 3%
Up previous day >= 10%
Volume today >= 50k shares
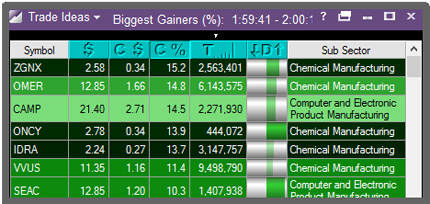
Top Percentage Daily Gainers
Top list of top percentage gainers on NYSE, AMEX and NASDAQ
Top Percentage Weekly Gainers
Top List of stocks up the most for the week on a percentage basis.
Top Percentage Monthly Gainers
Top List of largest monthly gainers on a percentage basis.
Top Dollar Gainers
Top List of Dollar Gainers on NYSE, AMEX and NASDAQ
Up from Upper Pivot (R2)
Top List of Stocks Above the Day's Upper Pivot Resistance (R2)
Up in 5 Minutes (%)
Up Most in 5 Minutes
Up in 15 Minutes (%)
Top List of Stocks Up the Most in 15 Minutes
Up in 60 Minutes (%)
Top List of Stocks Up the Most in 60 Minutes
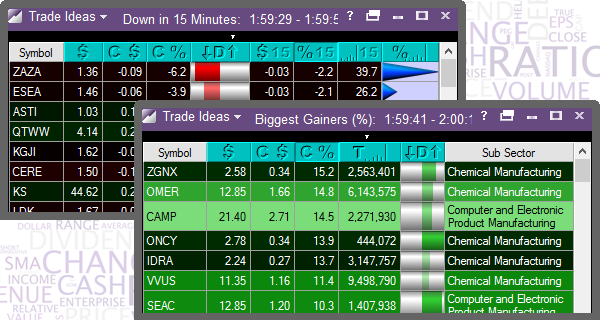
Top Percentage Losers
Top List of Biggest Percentage Losers on NYSE, AMEX and NASDAQ
Top Percentage Weekly Losers
Top List of Biggest Percentage Losers on NYSE, AMEX and NASDAQ
Top Percentage Monthly Losers
Top List of Biggest Percentage Losers on NYSE, AMEX and NASDAQ
Top Dollar Losers
Top List of Dollar Losers on NYSE, AMEX and NASDAQ
Short - Cut it Loose
Hold for 15 minutes; $0.50 Stop (optimized 9/25/13)
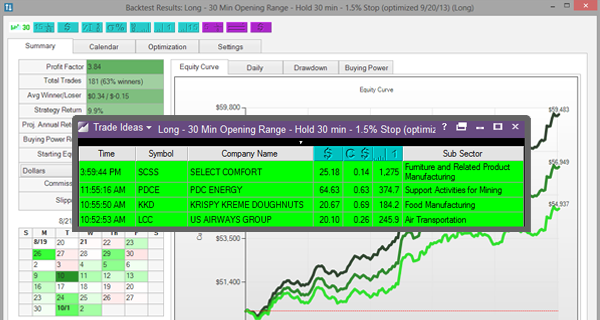
Long - Crossing Above Resistance
Hold for 30 minutes; 1.5% Stop (optimized 9/20/13)
Down from Lower Pivot (S2)
Top List of Stocks Down from the Daily Lower Pivot Support (S2)
Down in 5 Minutes
Top List of Stocks Down the Most in 5 Minutes
Down in 15 Minutes
Top list of stocks down the most in 15 minutes
Down in 60 Minutes
Top list of stocks down the most in 60 minutes
15 Minute Wide Range
15 Minute Wide Range
60 Minute Wide Range
60 Minute Wide Range
Daily Wide Range Bar
Top List of Daily Wide Range Bars
Volume Leaders
Top list of volume leaders on the NYSE, AMEX and NASDAQ
Relative Volume Leaders
Top list of relative volume leaders
5 Minute Volume Burst
Top list of 5 minute volume leaders
15 Minute Volume Burst
Top list of 15 minute volume leaders
Up Gappers
Top list of stocks that are gapping up
Down Gappers
Top list of stocks that are gapping down
Gappers > 5%
Look for up and down gap moves that are greater than +/- 5%
Most Consecutive Up Days
Top list of most consecutive up days (higher highs/lower lows)
Most Consecutive Down Days
Top list of most consecutive down days
5 Minute Up Candles
Most consecutive 5 minute up candles
5 Minute Down Candles
Top list of most consecutive 5 minute down candles
15 Minute Up Candles
Top list of the most consecutive 15 minute up candles
15 Minute Down Candles
Top list of the most consecutive 15 minute down candles
60 Minute Up Candles
Top list of most consecutive 60 minute up candles
60 Minute Down Candles
Top list of most consecutive down 60 minute candles
Up / Down from Close (2x vol)
As discussed on the message board.
Outer Bollinger Cross (Daily)
Top list of stocks that are at the extreme of their upper and lower daily Bollinger bands
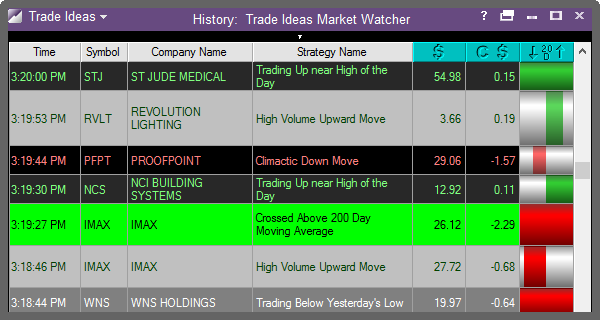
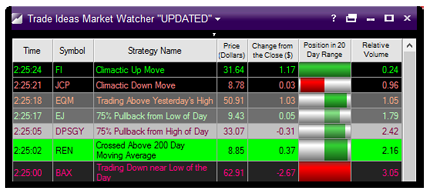
Market Watcher
Market Watcher contains many strategies you can turn on/off or customize, including:
Unusual Volume Spikes
Trading Below Support Price
52 Week Low
52 Week High
Trading Above Resistance Price
Crossed Above 200 Day Moving Average
Crossed Above 50 Day Moving Average
Crossed Above 20 Day Moving Average
Trading Below Yesterday's Low
Trading Above Testerday's High
Crossed Below 200 Day Moving Average
Crossed Below 50 Day Moving Average
Crossed Below 20 Day Moving Average
High Volume Upward Move
High Volume Downward Move
75% Pullback from Low of Day
Post Market High
Post Market Low
Pre Market High
Climatic Up Move
75% Pullback from High of Day
Trading Up Near High of Day
Rallying Off the Bottom
Trading Down Near Low of Day
Lifetime Low
Lifetime High
High Relative Volume
Climactic Move (5 min)
Climactic Move (5 min) contains several strategies you can turn on/off or customize, including:
Buy Setup at 20 SMA (5min)
Buy Setup Below 20 SMA (5min)
Buy Setup Above 20 SMA (5min)
Sell Setup at 20 SMA (5min)
Sell Setup Below 20 SMA (5min)
Sell Setup Above 20 SMA (5min)
Climatic Dowm Reversal (5min)
Climatic Bottoming Tail (5min)
Climatic Down (5min)
Climatic Up Reversal (5min)
Climatic Topping Tail (5min)
Climatic Up (5min)
Buy Signal BT at 20 SMA (5min)
Sell Signal TT at 20 SMA (5min)
Climactic Move (15 min)
Climactic Move (15 min) contains several strategies you can turn on/off or customize, including:
Buy Setup at 20 SMA (15min)
Buy Setup Below 20 SMA (15min)
Buy Setup Above 20 SMA (15min)
Sell Setup at 20 SMA (15min)
Sell Setup Below 20 SMA (15min)
Sell Setup Above 20 SMA (15min)
Climatic Dowm Reversal (15min)
Climatic Bottoming Tail (15min)
Climatic Down (15min)
Climatic Up Reversal (15min)
Climatic Topping Tail (15min)
Climatic Up (15min)
Buy Signal BT at 20 SMA (15min)
Sell Signal TT at 20 SMA (15min)
Down $.50 in Last 5 Min on Volume
ALERTS:
New Low (filtered)
Running Down Low
Block Trade
WINDOW SPECIFIC FILTERS:
Distance from inside Market
Change 5 Minute
Volume 5 Minute
NAME
![]()